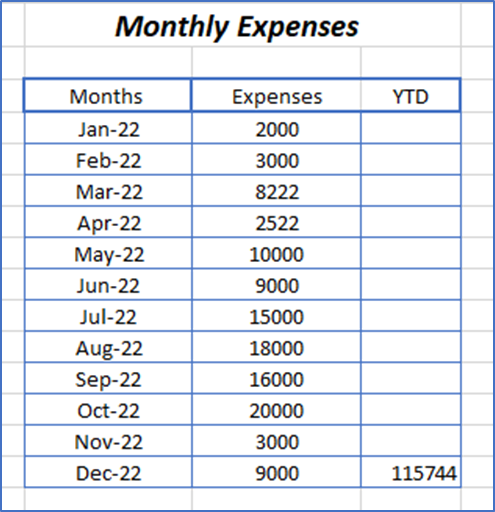
Create a expense sheet in Excel you want to convert into Graphs
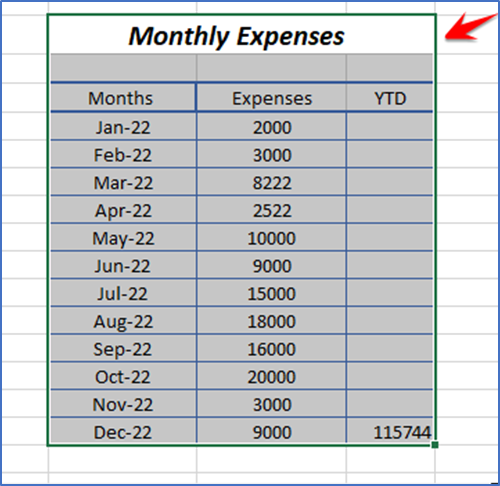
Select the data you enter and Press F11 key it will automatically Converted in Bar Graphs
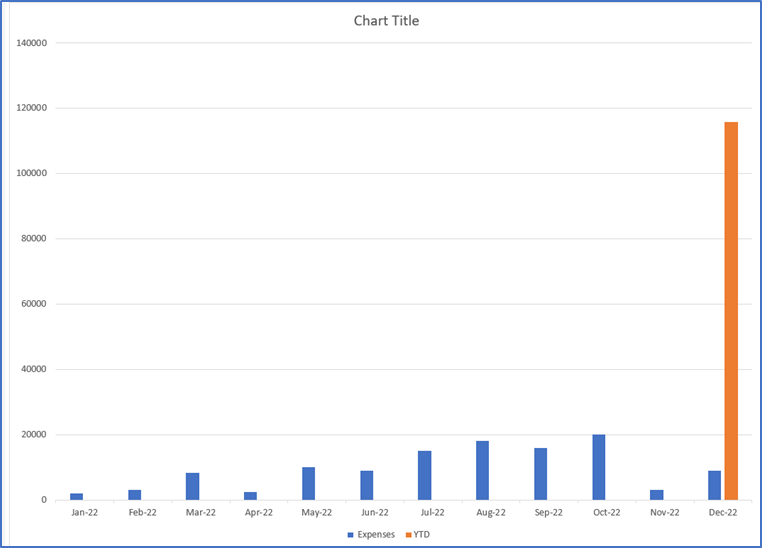
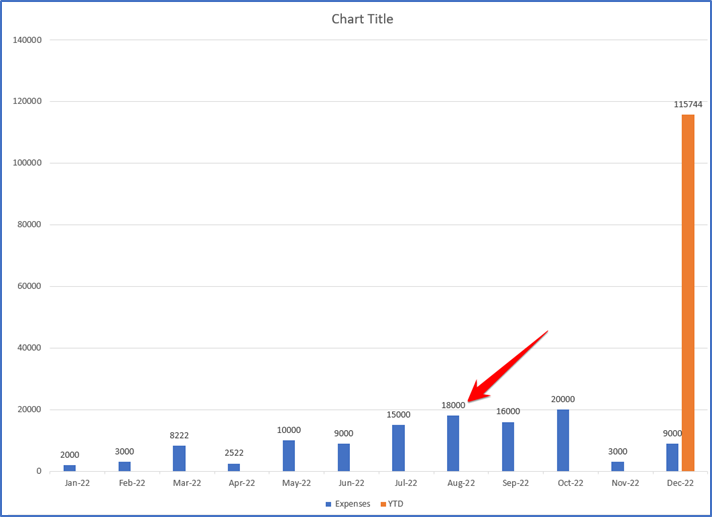
Here all expenses are in “Blue Bar” and year to date total year end Expense is “Orange Bar”
Create a expense sheet in Excel you want to convert into Graphs
Select the data you enter and Press F11 key it will automatically Converted in Bar Graphs
Here all expenses are in “Blue Bar” and year to date total year end Expense is “Orange Bar”